


hub, drawing from your raw data to elicit sharp insights. Utilizing custom formulas, create intuitive reports, and receive clear visualization of your data, you will an essential tool in developing your strategies.
Create calculations that reflect your own KPIs to draw further insights into how your strategy is being implemented.
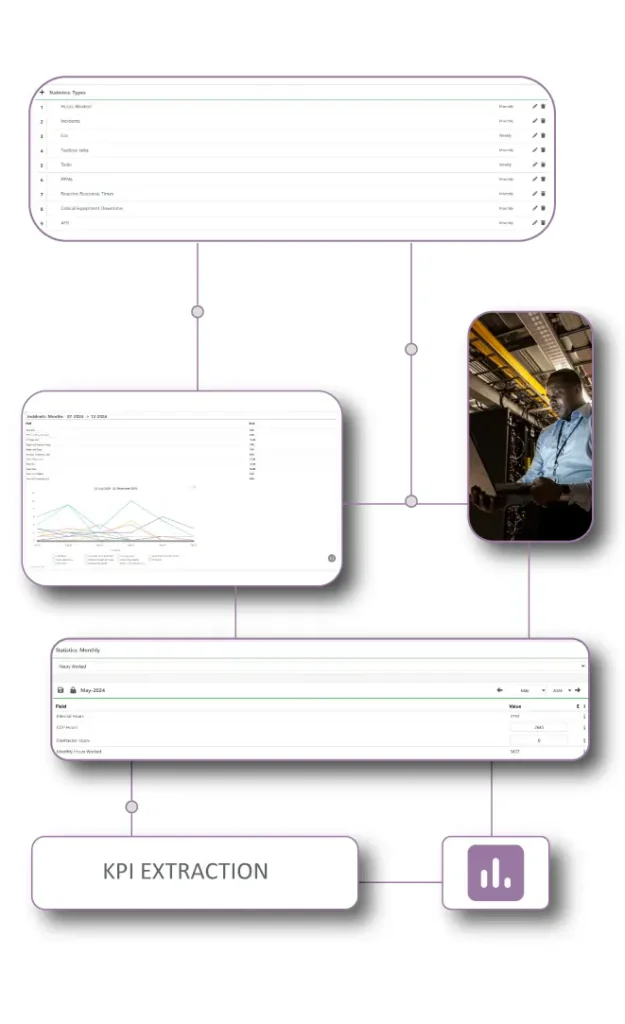
Visualize trends and patterns with a variety of chart types for clarity and impact.
Extract key safety, compliance, or performance metrics, tracking trends to identify any gaps in operational processes.
Provide tools for observing your data, enabling the identification of trends, patterns, and root causes of incidents.
Benchmark performances against industry standards or internal targets, identifying areas for improvement.
Use statistical analysis to inform risk assessments and prioritize safety interventions based on data-driven insights.
Support improvement efforts by providing data and analysis to evaluate the effectiveness of safety programs.
Our connected module means you upload information one time and it will be recorded wherever relevant. Here are just some of the Modules connected to Statistics.
Fill out the form below and one of our FlexPerts will contact you.