
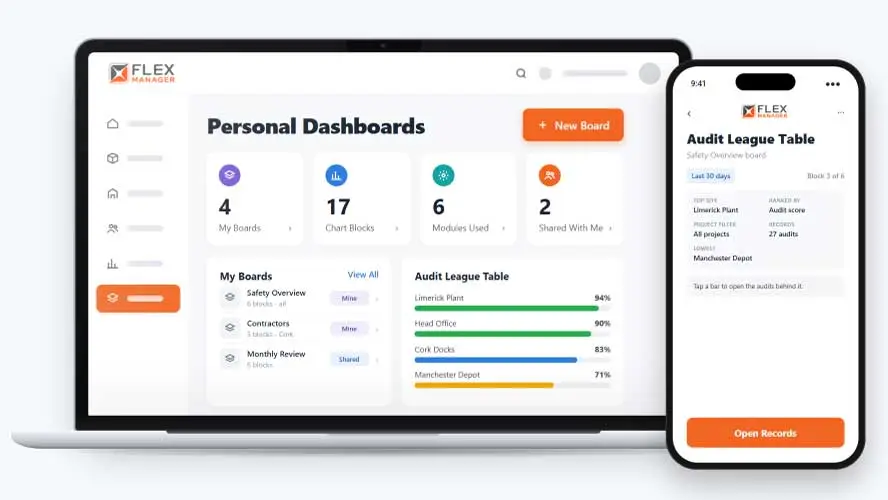
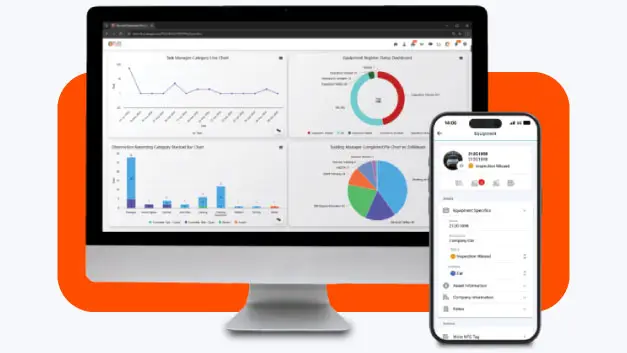
Figures from across FlexManager, on one board.
A dashboard that shows everyone the same generic view rarely shows anything valuable. FlexManager's Personal Dashboards solution lets each person filter by date, site, or type. Plus, it means they can drill straight into the source data behind any chart, and share a live view with the rest of their team.





Getting a clear view of your data often means exporting it into a spreadsheet and building charts by hand. By the time the report is ready, the figures are already out of date. When something stands out, there’s no quick way to see the records behind it. How do you see what’s happening across your sites, in the way you need to see it?
Exported spreadsheets
Each report is exported and merged by hand, so the figures are old by the time anyone reads them.
Pasted slide packs
Charts sit on a slide with no route back to the records, so every question means another export.
One report for everyone
The site manager and the director get the same fixed report, and both go digging for their own view.
From blank board to answer
Name a board, fill it with charts from the modules you use, and open the records behind a bar with one click.
Create
Build a board of live charts from across your FlexManager modules.
Compare
Put figures from different modules side by side on one board, allowing you to compare.
Filter
Filter each block by project, type, period, or tag; allowing you to get even more granular with your analysis.
Click through
Click a bar or slice to open the records behind it; break a slice down by a second field, such as project.
Key features & benefits
Advanced Filtering
Choose the data that's actually relevant, so a dashboard surfaces only the information that matters rather than everything at once.
Real-Time Integration
Live updates from across FlexManager modules keep a dashboard current automatically, so it doesn't need constant manual maintenance to stay ready for a decision.
Customizable Charts
Drag and resize chart blocks to lay out your own board.
One-Click Drill Down
Move instantly from an overview into finer detail, jumping straight into the minutae behind any chart or figure.
Secure Sharing
Share a copy of a dashboard securely to keep teams, departments, and sites aligned around the same view, rather than everyone working from a different picture.
See Personal Dashboards in action.
Bring a real case to the demo. We will build it live.
Built for those who want a snapshot of teams
Each person builds the board they need from the same live records, so the review starts with one set of figures.
Head of HSEQ
Is able to view incident injuries on a body-part chart; providing important context where needed.
Operations Director
Can look back over a week, month or year, or look ahead; allowing them to see trends or areas that need focus.
Site Manager
Filters each block to their own project and opens that board straight from the page header.
Maintenance Manager
Plots located inspections, maintenance, and incidents on a map.
Onboarding built around your needs. We're ready when you are.
We work to your pace and your team's availability. Your dedicated onboarding specialist takes care of the setup, so getting started stays simple.
Configuration
We configure FlexManager around your procedures.
Training
Short, role-based sessions for admins and field teams. Most users are confident after their first use.
Go Live!
Start with one site or roll out everywhere at once. Your account manager stays with you after launch.
Get started with Personal Dashboards
Frequently Asked Questions
What is FlexManager's Personal Dashboards module?
Personal Dashboards is a configurable reporting tool within FlexManager that lets each user build a live, filtered view of data drawn from across their connected modules. Rather than one shared report, every person can filter by date, site or type, choose the chart types that suit their data, and drill down into the underlying records whenever they need more detail.
Can I customize what data appears on my dashboard?
Yes. Personal Dashboards includes advanced filtering by date, site and type, so each user can narrow their view down to exactly what’s relevant to their role. Multiple chart and graph types are also available, so the same underlying data can be displayed in whichever format best suits how it’s being used.
How current is the data shown on a dashboard?
Dashboards update in real time as new information is logged across connected FlexManager modules, so there’s no manual refreshing, exporting or rebuilding required to keep a view current. This real-time integration also means a dashboard stays accurate on its own, without the ongoing upkeep a static report would need.
Can I see more detail behind a chart or figure?
Yes. One-click drill-down lets a user move straight from a chart or summary figure into the underlying records in the source module. That makes it easy to go from a high-level trend to the specific data behind it, without switching screens or running a separate report to find the detail.
Can a dashboard be shared with my team?
Yes. Dashboards can be shared securely with other users, so teams, departments or sites can stay aligned around the same live view of the data that matters to them. Sharing a dashboard doesn’t prevent individuals from also keeping their own personalised version filtered to their specific role.
What are the benefits of using Personal Dashboards?
By giving each user a live, filtered view of their own data, Personal Dashboards supports smarter, faster decision-making, since information doesn’t need to be pulled together manually first. It also improves collaboration by letting teams share a consistent view, saves time that would otherwise go into manual reporting, and increases accountability by keeping relevant data visible and easy to check.
Why choose FlexManager for personal dashboards?
FlexManager has been building workplace and HSEQ software since 2011, shaped by hands-on safety and quality management experience rather than generic BI design. FlexManager is certified to ISO 9001, ISO 14001, ISO 27001 and ISO 45001 certification covering quality, environmental, information security and safety management. For Personal Dashboards, that means the figures a user drills into come straight from the same secure, audited records used across the rest of the platform, not a separate reporting layer disconnected from the source.