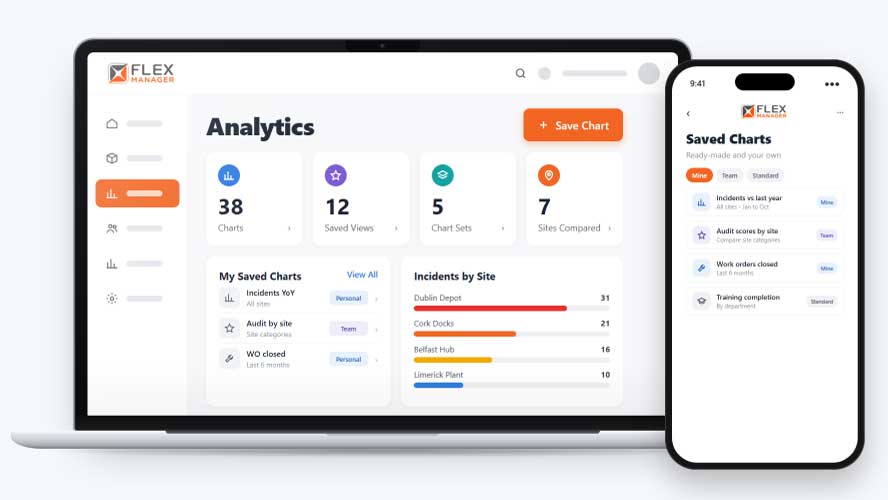
Analytics you can use to transform safety insights into meaningful actions.
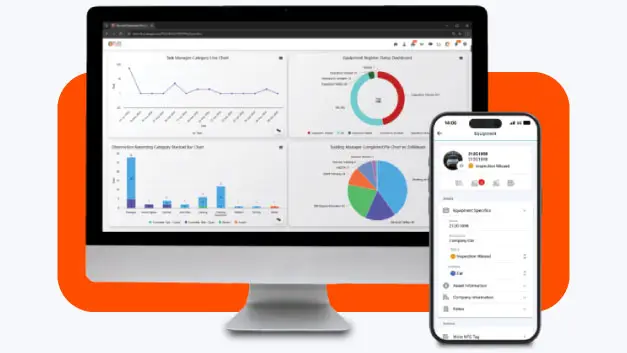
Turn operational, compliance, and safety data into meaningful insights. The FlexManager Analytics module helps organisations monitor performance, identify trends, and make informed decisions using real-time dashboards, reporting, and data visualisation across connected business processes.


Struggling to extract meaningful insight from the large volume of compliance and operational data you have? It’s a challenge many operations face on a day-to-day basis. It can gatekeep you from your own operational efficiency and deny you the opportunity to make improvements, help teams understand performance, or identify trends.
Spreadsheets rebuilt by hand
Every month someone copies exports into a workbook and redraws the same charts.
No like-for-like comparison
Comparing this quarter with last year means digging out old files that may not match.
Everyone wants their own cut
Each manager asks for their own sites and categories, so the same report is rebuilt again and again.
From records to the board meeting
Analytics starts with having access to the right data, ready for whoever needs it.
Pick
Choose ready-made data from your modules, including your own incident form lists.
Filter
Set the date range, then include or exclude sites, site categories, tags, and module fields.
Compare
With most data, add the same period last year or the period before, or put sites against each other.
Save and share
Save the view in your menu, or set up a chart set for a user group.
Key features & benefits
Interactive Dashboards
Visualise key operational, safety, and compliance analytics in a central location, helping decision-makers quickly understand performance and identify emerging issues.
Real-Time Reporting
Access up-to-date information from across the FlexManager platform, helping enable faster responses to risks, non-conformances, and operational trends.
Configurable Data Views
Tailor reports and dashboard views to specific roles, departments, or business priorities, helping ensure that stakeholders see the information most relevant to them.
Trend Analysis
Analyse historical and current performance data to identify recurring issues, measure improvement initiatives, and support evidence-based decision-making.
Cross-Module Insights
Bring together information from connected FlexManager processes to provide a broader understanding of compliance, operational, and safety performance.
Performance Monitoring
Track key indicators and organisational objectives through visual reporting tools that support accountability and continual improvement programmes.
See Analytics in action.
Bring a real case to the demo. We will build it live.
Insight for leaders and operational teams
From the board to the site office, everyone works from charts of the same records.
HSEQ Manager
They can compare incidents and audits, including environmental and quality ones, with last year by site, and open the records behind a chart.
Operations Director
Are able to put sites or site categories against each other and export the figures for the board pack.
Site Manager
Can open saved charts filtered to the sites chosen from the menu, and share a chart set with a colleague.
Maintenance Manager
These individuals can follow work order and maintenance charts over time, switching to a ranged timeline grouped by day, month, or year.

How Tarmac used Analytics to decrease paperwork and receive insights
See how our Analytics module was used by Tarmac to assist in KPI and site management, while also benefitting from data takeaways from live dashboards.
Onboarding built around your needs. We're ready when you are.
We work to your pace and your team's availability. Your dedicated onboarding specialist takes care of the setup, so getting started stays simple.
Configuration
We configure FlexManager around your procedures.
Training
Short, role-based sessions for admins and field teams. Most users are confident after their first use.
Go Live!
Start with one site or roll out everywhere at once. Your account manager stays with you after launch.
Get started with Analytics
Frequently Asked Questions
What is compliance analytics software?
Compliance analytics software helps organisations analyse and visualise compliance, operational and safety data. Rather than reviewing information across multiple spreadsheets or systems, users can access dashboards, reports and trends that support more informed decision-making and performance management.
What does the FlexManager Analytics module do?
The Analytics module provides reporting and dashboard capabilities across the FlexManager platform. It helps organisations turn operational and compliance data into meaningful insight, making it easier to monitor performance, identify trends and support continual improvement initiatives.
How can analytics improve compliance performance?
Analytics helps organisations identify patterns, risks and performance gaps more quickly. By providing visibility of key information, managers can prioritise actions, monitor progress and make decisions based on evidence rather than assumptions.
Can Analytics bring together data from different FlexManager modules?
Yes. The Analytics module is designed to support visibility across connected FlexManager processes. This allows organisations to gain a broader understanding of performance by analysing information from multiple operational and compliance activities within the platform.
Who should use the Analytics module?
The module is intended for decision-makers who need clear visibility of organisational performance. It is particularly useful for HSEQ professionals, Compliance Managers, Operations Managers, Quality Managers and senior leaders responsible for monitoring objectives, risks and business outcomes.
What business problems does Analytics help solve?
Analytics addresses a lack of visibility into organisational performance and risk. Many businesses collect significant amounts of data but struggle to translate it into practical insight. The module helps users identify trends, monitor key metrics and focus attention on areas requiring action.
How does Analytics support continual improvement?
Analytics helps organisations measure progress and identify opportunities for improvement. By tracking trends over time and monitoring key performance indicators, businesses can evaluate the effectiveness of initiatives and make more informed strategic decisions.
Can dashboards be tailored to different users?
Yes. Analytics supports presenting information in ways that are relevant to different stakeholders. Operational managers, compliance teams and senior leadership often require different views of organisational performance, making role-relevant reporting important for effective decision-making.