
Every site's KPIs, gathered overnight.
Generic dashboards show you what's happening, but not whether it's actually working against the targets that matter to your organisation. FlexManager's KPI Statistics module lets you build custom formulas around your own KPIs, turning raw data into benchmarked insight you can use to prioritise safety interventions and track real progress.









When your data is scattered and inconsistent, that can be a challenge. Equally, even if you have the data, but not the means to interpret what it represents, that can be a roadblock.
Counts retyped
Incident, audit and inspection counts are copied by hand from one system into another, every week.
Spreadsheets by email
Every site sends its own version, in its own layout, a little later each month.
History lost
Once the live list is cleared, last month's overdue figure is gone, and so is the trend.
From records to KPIs
Set the list up once; the figures fill themselves in each night, and sites add the rest.
Decide
Agree on what KPIs are a priority for you.
Gather
Every night, counts are gathered for each site from incidents, audits, work orders, and more.
Add and work out
Type in the figures no other module records; overnight formulas turn the figures into rates you report.
Lock and compare
Lock an agreed week that only a super administrator can unlock; compare sites and site categories on one chart with Analytics
Key features & benefits
Tailor-Made Formulas
Create calculations that reflect your own KPIs, drawing further insight into how your strategy is actually being implemented rather than relying on generic, off-the-shelf metrics.
Chart Selection & Visualisation
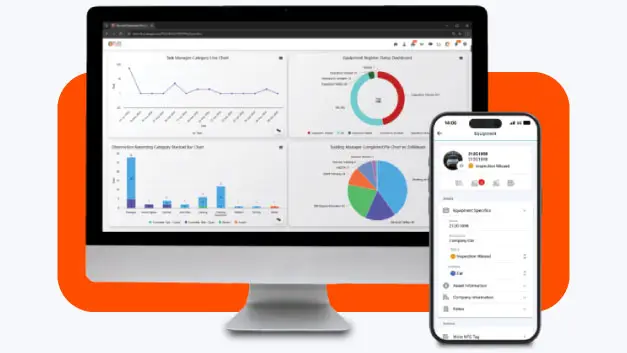
Visualise trends and patterns using a variety of chart types, giving your data clarity and impact rather than leaving it as rows in a spreadsheet.
Root-Cause Pattern Identification
Observe your data to identify trends, patterns and root causes behind incidents, rather than treating each number as an isolated figure disconnected from the bigger picture.
Performance Benchmarking
Benchmark performance against industry standards or your own internal targets, so you can see exactly where the gaps are and where improvement is actually needed.
Data-Informed Risk Prioritisation
Use statistical analysis to inform risk assessments and prioritise safety interventions based on what the data actually shows, rather than instinct or whoever raises their concern loudest.
See KPI Statistics in action.
Bring a real case to the demo. We will build it live.
Built for anyone who measures progress against a target
From the site office to the board pack, everyone reads the same figures for the same week.
HSEQ Manager
Can run each KPI list weekly or monthly; delivering key insights.
Site Manager
Types in only the figures no other module records, then locks the week once it is agreed.
Operations Director
Compares sites on one chart, puts weekly figures on dashboards, and gets them by site in a scheduled report.
Head of HSEQ
Has a stored figure for every finished week and month, with when it was set and who last saved it.

York 1
Used the KPI Statistics module owing to analytics being of upmost importance; records could be pulled up at the click of a button, rather than going through conventional, paper-centric methods.
Onboarding built around your needs. We're ready when you are.
We work to your pace and your team's availability. Your dedicated onboarding specialist takes care of the setup, so getting started stays simple.
Configuration
We configure FlexManager around your procedures.
Training
Short, role-based sessions for admins and field teams. Most users are confident after their first use.
Go Live!
Start with one site or roll out everywhere at once. Your account manager stays with you after launch.
Get started with KPI Statistics
Frequently Asked Questions
What does FlexManager's KPI Statistics module do?
It lets you build custom formulas around your own KPIs, turning raw operational data into visual reports and benchmarked insight. Rather than relying on generic, pre-built metrics, you define the calculations that actually reflect your organisation’s strategy and use them to track trends, gaps and root causes over time.
Can I create my own KPIs rather than using preset metrics?
Yes. Tailor-made formulas let you create calculations that reflect your own KPIs, so the insight you’re drawing out is based on how your strategy is actually being implemented rather than a generic set of metrics that may not apply to your organisation.
What kinds of charts can I use to visualise the data?
A variety of chart types are available to visualise trends and patterns, so the same underlying data can be presented with the clarity and impact that suits the audience or metric you’re reporting on.
Can Statistics help benchmark performance against industry standards?
Yes. Performance can be benchmarked against industry standards or your own internal targets, helping identify exactly where the gaps are and where improvement is genuinely needed, rather than assuming performance is on track.
Does the module help identify the root causes behind incidents?
Yes. KPI Statistics provides tools for observing your data to identify trends, patterns and root causes behind incidents, so a recurring issue can be traced back to its underlying cause rather than treated as a series of unrelated events.
Why choose FlexManager for statistics and KPI reporting?
FlexManager has been building practical compliance software since 2011, with hands-on HSEQ expertise behind every module we build. FlexManager is certified to ISO 9001, ISO 14001, ISO 27001 and ISO 45001 certification. For statistics and KPI reporting specifically, that hands-on background is why the module is built around the metrics that actually matter for safety and compliance, not generic business reporting.